How to Revitalize Campaigns with Facebook's Inspect Dashboard


If you've been in the marketing and advertising world for a bit, you're probably super comfortable with creating Facebook ads.
If you're like me, you've probably obsessed numerous times over creating just the right video or photo content for any given campaign and spent hours mulling over the best audience to target and working tirelessly to optimize your ads once they've launched.
You get things running smoothly and you feel like you're on top of the world... until... things start to taper off.
And when that happens, what do you do?

Thankfully, Facebook has a couple of tools to help you diagnose your underwhelming campaigns so you can get them back on track.
The tools we will be going over are the Facebook Delivery Insights as well as the Inspect Dashboard.
Facebook's Inspect Dashboard
The handy Facebook Inspect Dashboard was launched back in June of 2019. You can find it at the Adset level of your campaign set up. If you are familiar with the Delivery Insights dashboard, you will find a lot of common features. Overall, it gives you insight into your adset delivery and also helps you troubleshoot your audience and the overall performance of your ads.

The general breakdown is as follows:
- Summary
- Bid Strategy
- Auction Competition
- Audience Saturation
- Auction Overlap
- Edit History
Summary Section
The thing we like most about this tool is its graphical nature. It is much easier to see trends and correlations while looking at a graph compared to a headache-inducing pile of numbers.
While setting up a new campaign, you can hover over the adset name and you will see the Inspect option. This section is great because it shows you all the key information in both numerical and graphical format. Click through each metric box to see the corresponding data on the graph. You can graph as many lines as you want, but don’t overdo it! We suggest starting out with 1-3 to keep things nice and readable.
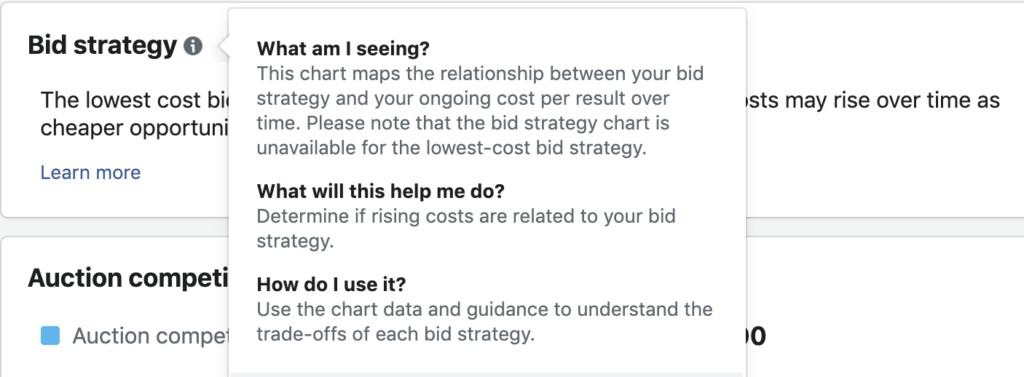
Bid Strategy
This area helps you understand your bid strategy and its connection to your cost per result over time. Note that you can’t see any graphs while using the ‘lowest-cost bid’ option. Any other option will provide a graph. It can help you figure out if your costs are going up because of your bid strategy.

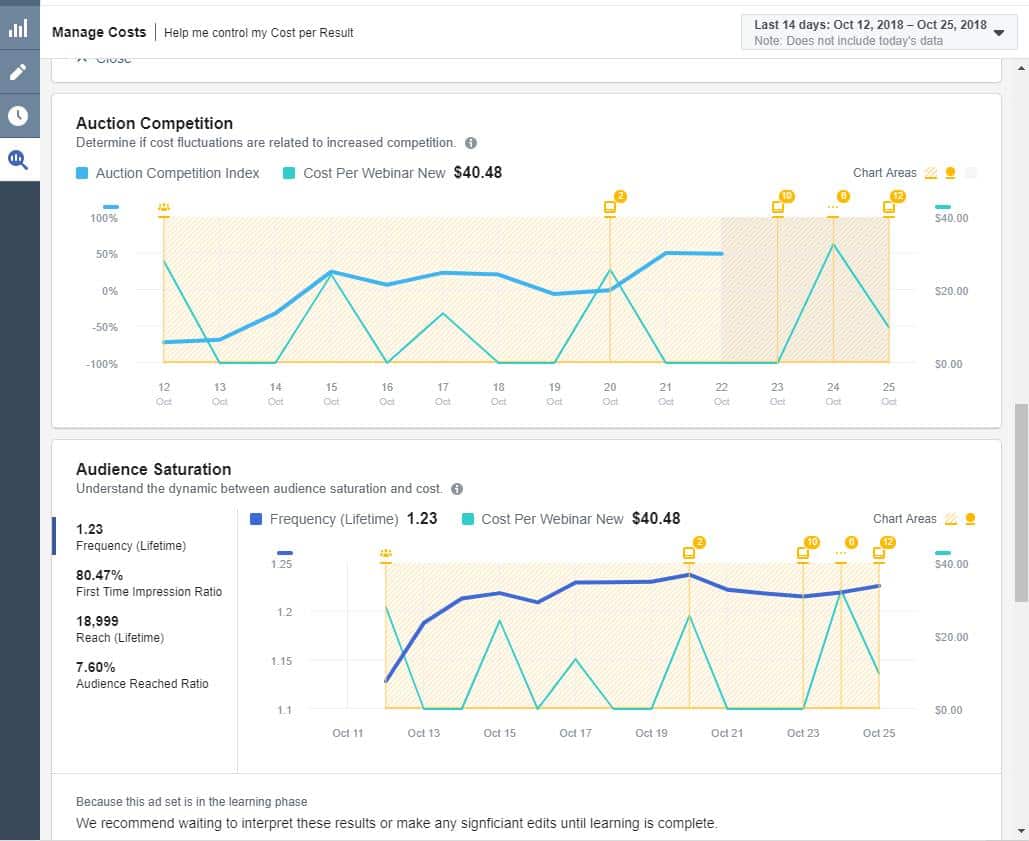
Auction Competition
Every ad you place enters into an auction, so the price can fluctuate depending on the competition.
If you were to run ads over a big holiday like Black Friday, the ad pricing would be much higher than usual. This is due to the huge amount of advertisers running ads for their campaigns at the same time. Compare your CPA to the auction competition to see if your increase in cost is due to others running ads at the same time as you.
A few tips to consider if you have some serious ad competition: Try broadening your audience or using more placements. Switching up your ad type can also help you out here.
Audience Saturation
This metric can be helpful on your campaigns that have been running for a while. It will help you make the decision between keeping the ad running and pulling the plug. The basic utility of this section is to see the relationship between your cost and the audience your ads are reaching. A decline in performance can oftentimes be caused by a high audience saturation.

We recommend checking the first impression ratio to determine if you are still reaching new people in your audience.
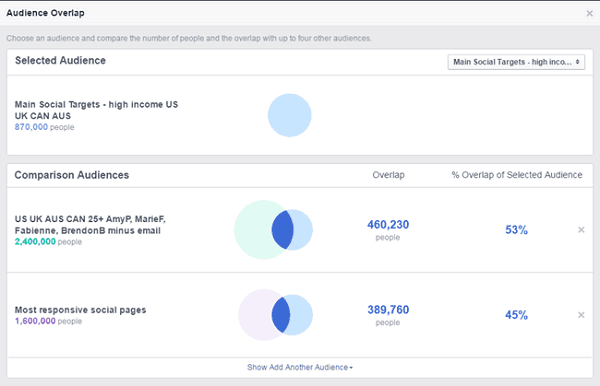
Audience Overlap
While running your campaigns, it will be to your benefit to avoid overlapping adsets that compete for the same audience. This section will show you how often your adsets end up in the same auction as another one of your ads in the same account. If your ads are competing against each other, Facebook may pick a single winning ad and under-represent the rest.

This is often what causes an ad to under-deliver. Facebook suggests merging similar ads if this is happening to you.
Edit History
As you can probably guess from the name, this section shows every update that has been made to your adsets. It also gives insight into who made the edits. If your ads are underperforming from a specific point in time and you are unsure why, check this tab! Oftentimes a significant edit can throw your ad back into the learning phase by accident. Consult with the information here to dial in on your error.
Conclusion
Overall, the Inspect dashboard is something you should implement into your campaign set up and maintenance. It has many helpful sections to help you understand what is happening with your ads, and will show you ways to reduce costs and save money! Our advice is to get familiar as soon as you can. Try analyzing a few different adsets before you come across an underperforming campaign. That way, you will be comfortable with the layout, and know what to look for.
If you want more advanced, in-depth tips and methods from myself and other experts, join our premium group at www.joinadleaks.com.


