How to Make Product Journey, Sales Cycle, and LTV Reports Your New Secret Weapon

We are giving away the keys to the kingdom.
People pay agencies and consulting firms a whole lot of money to perform the four-step analysis below.
Now with Triple Whale, some screenshots, and Notion, you can build insanely robust reports in minutes.
And because we love you all so much, we created a Notion Template you can duplicate.
(Don’t have Notion? It’s free and incredible. Sign up here.)
Now that you have Notion, all you have to do is: duplicate the Notion template, replace the screenshots with yours, change placeholder text to your numbers and fire it off!
Congrats! You just completed a robust Product Journey, Sales Cycle, and LTV Analysis for your business or client’s business in minutes.
(What a time to be alive!)
The first of the two links below is the Example report, which is what your final deliverable should resemble. The second link is to the Prebuilt Report to fill in with your numbers.
- Link to the Full Example Report sent out to the client.
- Link to Fill in Blanks Report - Notion Template.
Step 1: Identify Top Products 🕵🏻
First and foremost, you’ll need to find out what your top-selling products are.
To do that easily, open up Triple Whale and go to Analytics → Products. There will usually be a clear distinction between your A and B teams.
And to identify the products that are worth analyzing are, use order thresholds or sales minimums. In other words, only look at products with at least Y amount of orders YTD or X amount of sales.
Once you identify the products, grab a screenshot for your report:
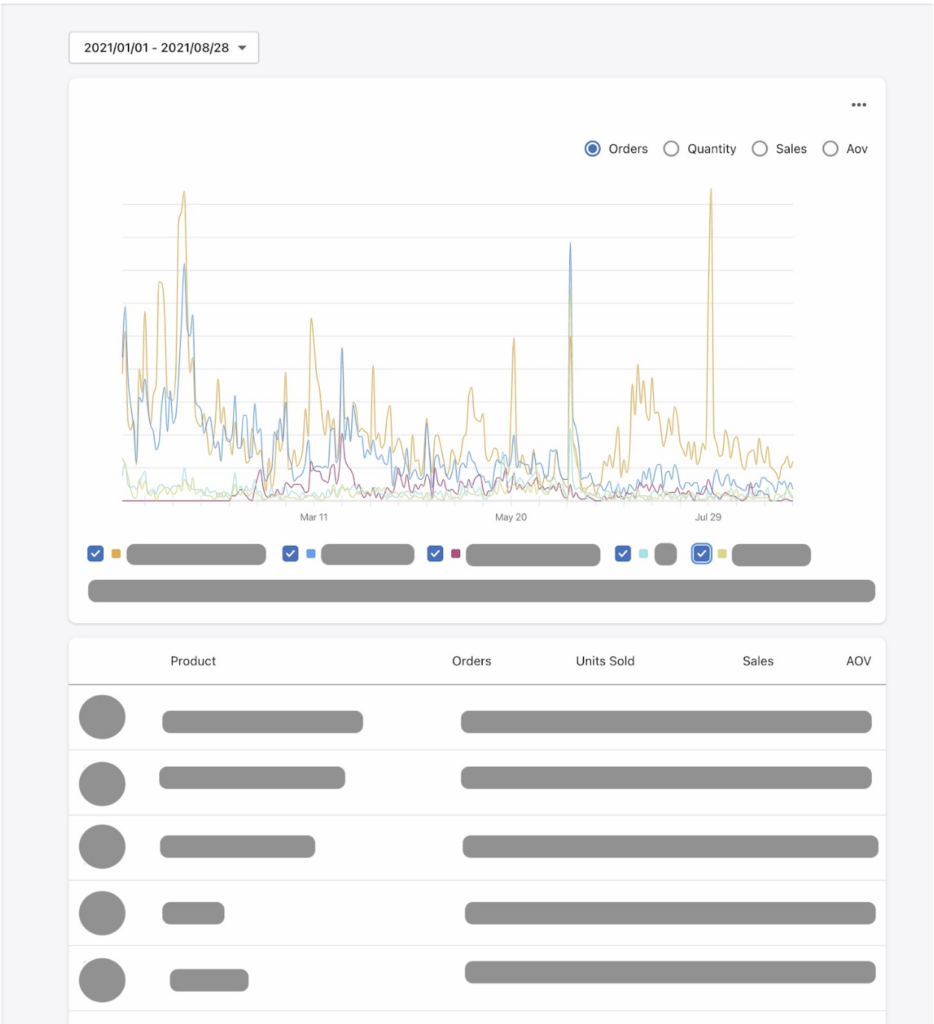
For this business, there are five products worth analysis:
- Top Knot Ponytail
- Lulu Two Strand
- Lulu Two Strand Bundle
- Halo
- Arisa Fishtail
Step 2: Review LTV 🤑
Now that you know what the best-selling products are, let’s see how they net out in terms of LTV versus the whole shop.
To do that, open Analytics → LTV 60/90 Days in Triple Whale. You can check the LTV of top-selling products and benchmark them against Shop averages. Here’s another screenshot:
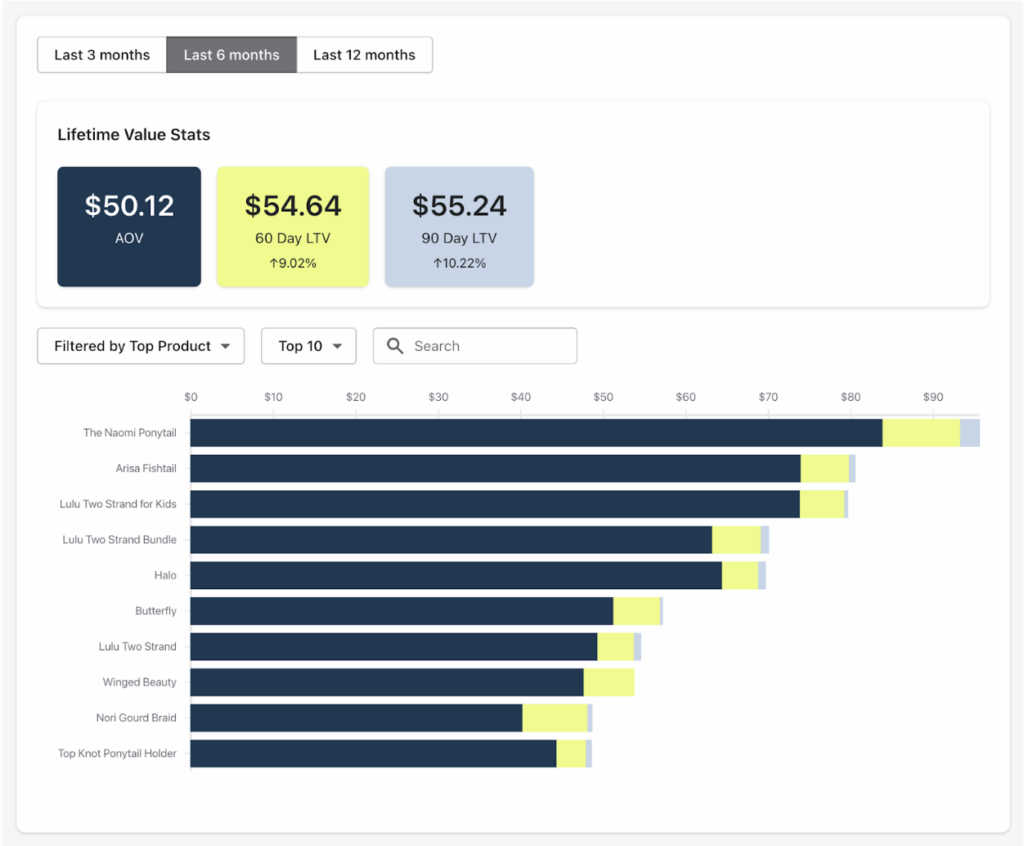
All our top sellers are in our top 10 LTV. This is good!
A few things to note here:
- Why isn’t The Naomi Ponytail in the top 5 of sales with such a strong AOV?
- Lulu Two Strand Bundle has healthy economics. Why isn’t it in the top 5 of sales?
- Not a lot of variation in AOV and 60/90 day LTV. Why?
Note #1: AOV is a function of purchase frequency (Total sales/Total purchases) & LTV is a function of unique customers (Total sales/Unique customers).
Note #2: There are a few different ways to calculate LTV. We prefer Total Sales/Unique Customers. You will also see it represented outside of Triple Whale as Avg Order Profit * Order Frequency and other variations.
Step 3: Sales Cycle ♻️
The next thing we want to check is the length of the sales cycle.
How many days between a customer’s 2nd, 3rd, and 4th order?
Looking at the sales cycle will allow you to see the whole customer journey and identify the optimal times to message or RT your users.
High-level stuff!
Hop over to 🐳 Analytics → Time Between Orders.
Grab a screenshot of the benchmarks.
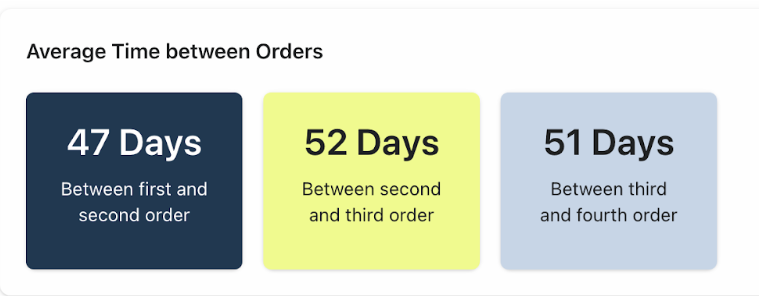
Evaluate the order distribution by day and look for the biggest clusters with the highest orders. I know; super scientific. #science
This will be the most opportune time to message your customers.
**Note: I only included the top product for brevity. I did analyze all five. They are included in the final report.
Top Knot Ponytail Sales Cycle 🥇

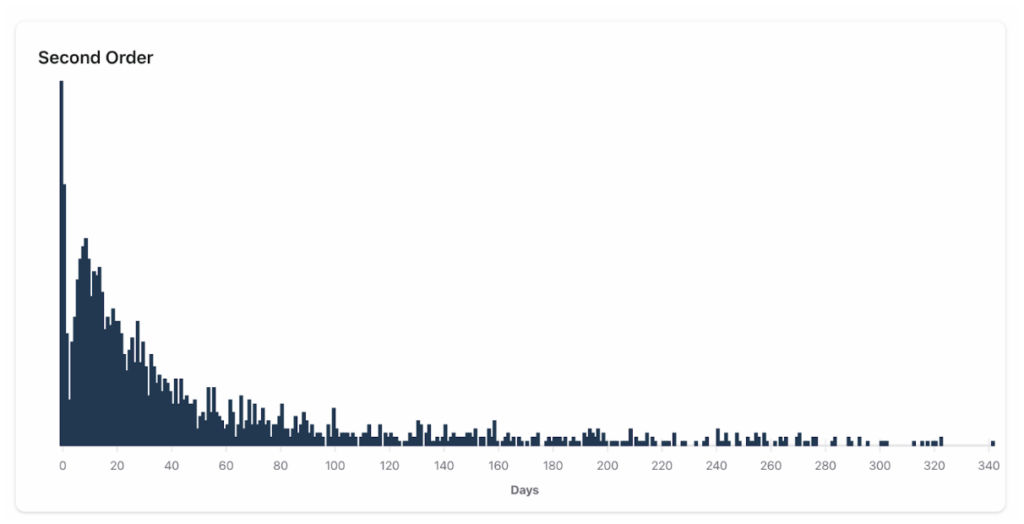
Ideal Messaging window for 2nd Order: Day 0 (think post-purchase upsell or cross-sell) and Day 5 to Day 15.
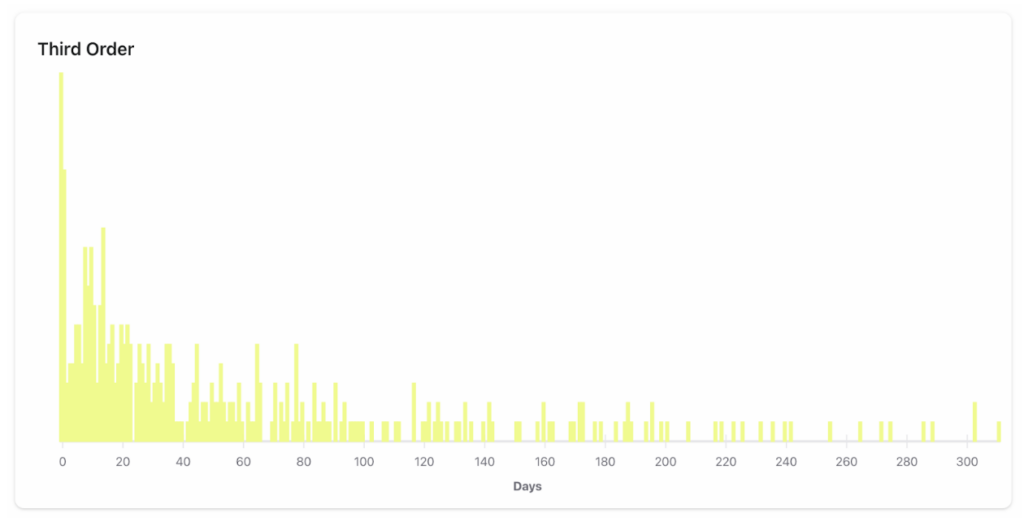
Ideal Messaging window for 3rd Order: Day 0 to Day 1 and Day 6 to Day 14.
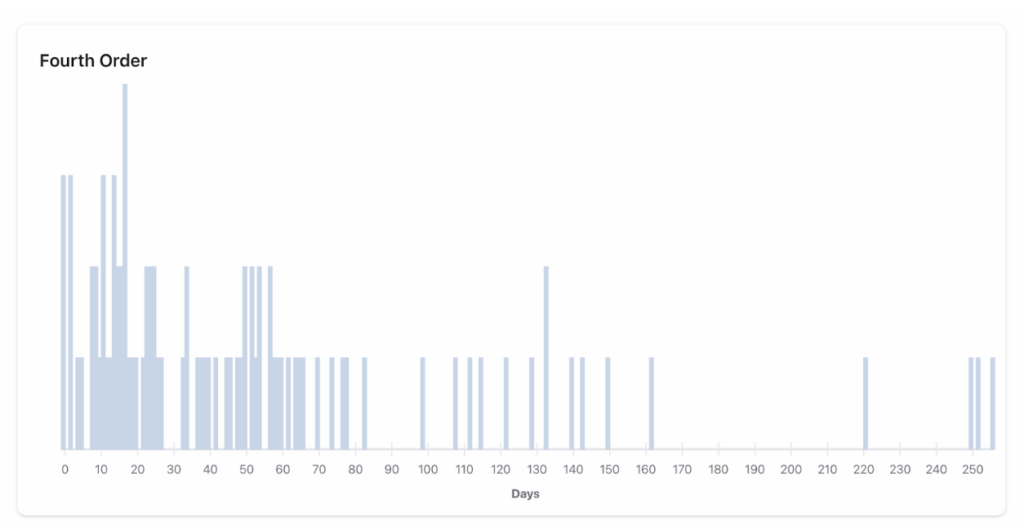
Ideal Messaging window for 4th Order: Day 0, Day 2, and Day 6 to Day 14.
Step 4: Product Journey 🗺️
I love metaphors. So let me give you a metaphor:
🍺 1st Purchase = Date
🥂 2nd Purchase = Engagement
💍 3rd Purchase = Marriage
You want people to marry one or more of your products.
A product journey is a visual representation of loyalty and preference. Don’t ask me what I think. Look at what I do.
Three Main Questions you want to answer:
- Is the product acting as a gateway to my top products or a gatekeeper?
- Can I bundle with other products to improve economics?
- Should I offer a subscription to shorten the sales cycle?
Two more things you want to derive from the product journey: the most prominent journey and the golden path of that product. We refer to these as:
- The Golden Path (most prominent)
- The Product Golden Path (path to third order of product)
This will make more sense when you see the graph and analysis below. Let’s go through three different products.
Jump over to 🐳 Analytics ->Product Journey
Grab screenshots of every product you analyzed.
Note #1: I included three here for brevity. All are in the final report.
Note #2: How did I obtain the percentages? They show on the chart when you hover over the path in Triple Whale.
Top Knot Ponytail Product Journey
This is a top seller and has incredible loyalty. First Purchase of Top Knot Ponytail leads to a second purchase of:
- 45% Top Knot Ponytail
- 8% Lulu Two Strand
- 6% Naomi Ponytail
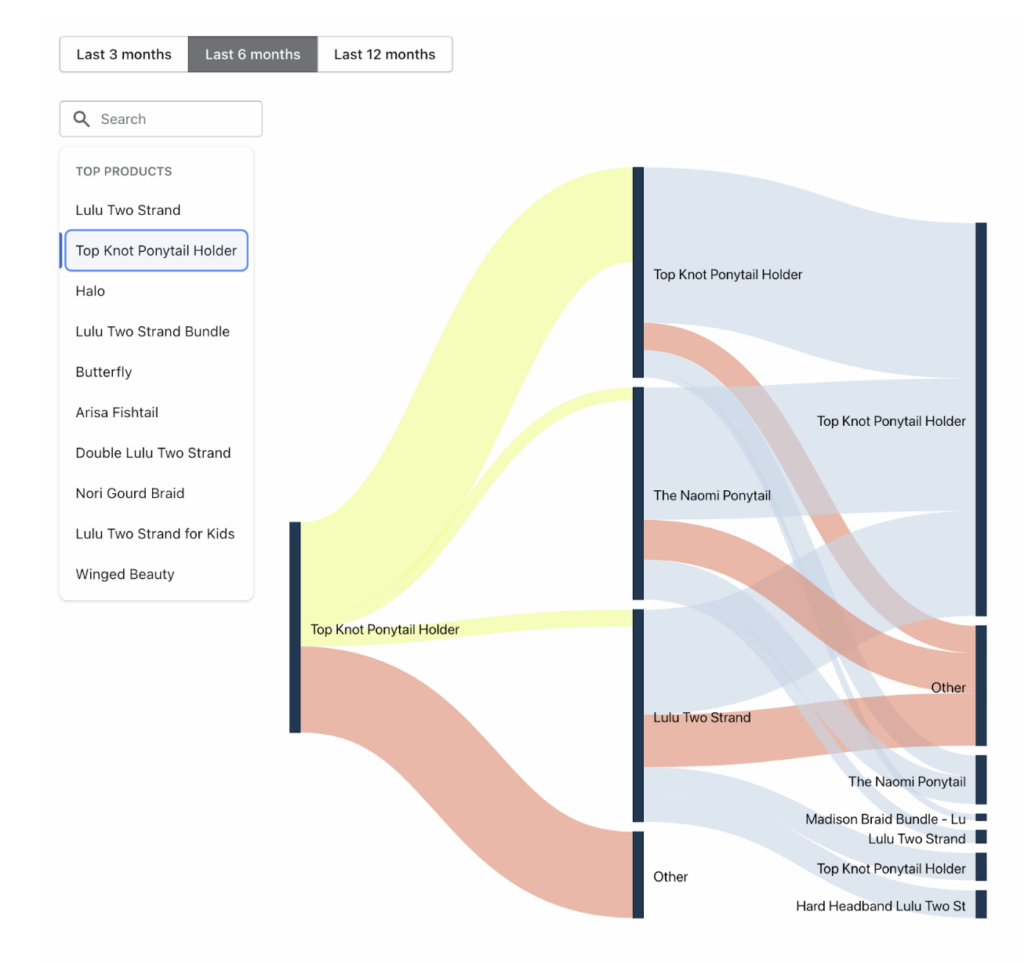
Golden Path Analysis: For people who purchased the Top Knot Ponytail first, 45% came back and purchased a Top Knot Ponytail a second time and 74% (of the previous 45%) came back to purchase a Top Knot Ponytail a third time. This is fantastic.
Product Golden Path: Same as Golden Path. This is ideal. A sign of a great/popular product is that the subsequent cohorts grow. In this case, the second to third order cohort improved by almost 30 points (45% →74%). Super strong.
On top of that, people try different products (The Naomi & Lulu Two Strand) and a majority come back to the Top Knot.
In conclusion, this is THE pillar product for the business and generates high-value repeat customers and brand loyalty.
This product should be at the tip of the spear in paid media and organic. A significant amount of spend and organic resources should be allocated to promoting this product.
Lulu Two Strand Product Journey
This is another top-selling product, but immediately you see that it has a completely different anatomy. This product looks like it’s doing well by the numbers. In reality, it’s generating low-value suboptimal customers.
This is the exact reason why customer journeys are so important.
The majority of first purchasers purchase a different product on their second order. More to the point, they don’t purchase a top-selling product that generates lock-in, LTV, and brand loyalty, i.e. the Top Knot or The Naomi Ponytail.
Instead, the first purchase of Lulu Two Strand leads to a second purchase of:
- 17% Top Knot Ponytail Holder
- 11% Lulu Two Strand
- 7% Halo
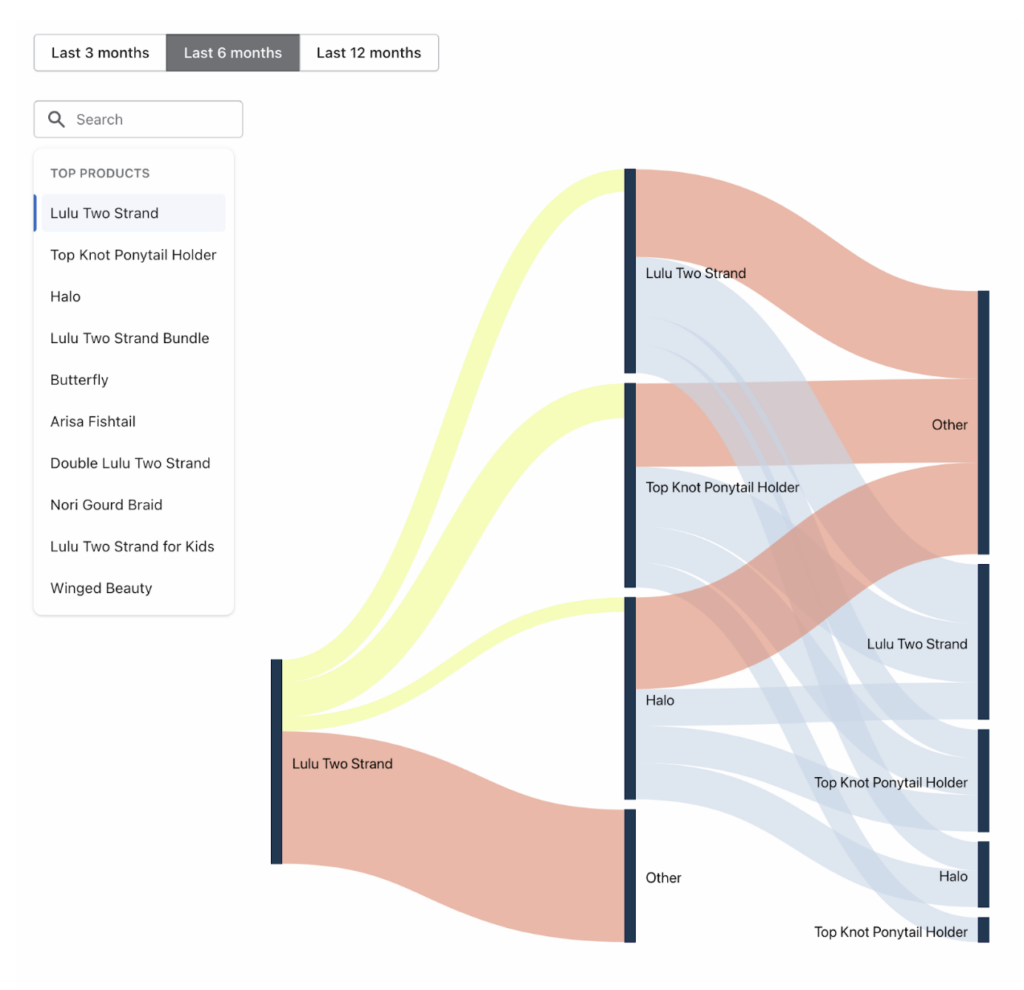
Golden Path Analysis: Of the people who purchased the Lulu Two Strand first, 65% came back and purchased Other for their second order.
Product Golden Path: Of the people who purchased the Lulu Two Strand first, 17% came back and purchased a Lulu Two Strand a second time and 43% (of the previous 17%) came back to purchase a Lulu Two Strand a third time.
In conclusion, The Lulu Two Strand is acting as a gatekeeper to the best products. This in turn leads to subsequent suboptimal product experiences and a degradation of brand value. Not great.
There is a small, but decently loyal (17%→43% not super awesome) set of consumers who enjoy this product. I wouldn’t kill this product. With that being said, I wouldn’t put paid media or big organic initiatives behind it.
The Naomi Ponytail Product Journey
Remember when we checked the LTV charts and the Naomi Ponytail popped up? Well, when you check out the product journey, turns out it’s a great product to promote.
The first purchase of The Naomi Ponytail leads to a second purchase of:
- 34% Top Knot Ponytail Holder
- 8% Lulu Two Strand
- 7% Lulu Two Strand Bundle
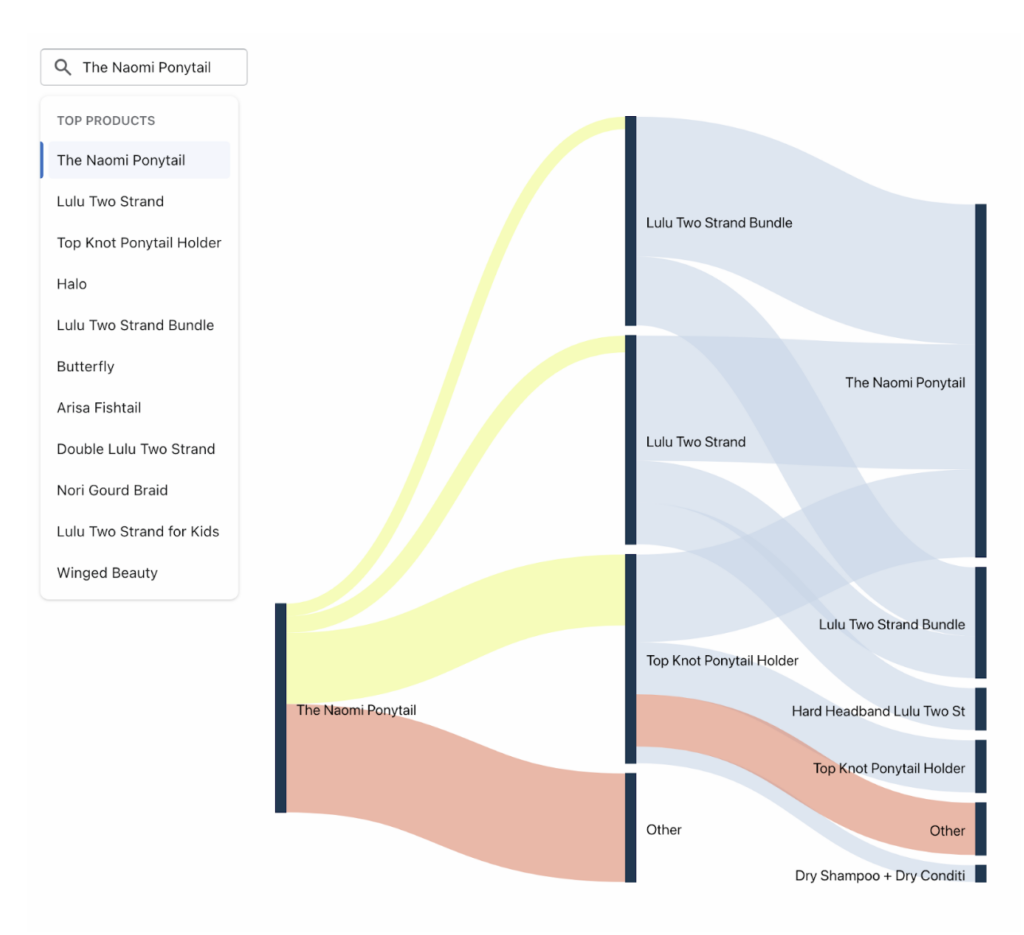
Golden Path Analysis: People who purchased The Naomi Ponytail first, 52% came back and purchased Other for their second order.
Product Golden Path: People who purchased the Naomi Ponytail first, 0% came back and purchased a The Naomi Ponytail a second time and 0% (of the previous 0%) came back to purchase a The Naomi Ponytail a third time.
Note: The Naomi Ponytail was the most purchased item for order number three.
In conclusion, this is the definition of a gateway product. Not purchased a second time, but purchased a ton a third time. In addition, over a third of buyers are purchasing the best-selling product on the second order. Perfect.
Step 5: Fill in this report ✍🏻
Now try performing this analysis with one of your clients. You’ll be amazed by their response!
- Duplicate this Notion doc.
- Add Screenshots, change product names & numbers.
- Send client report.
- Print Money 🙌🏼.
Want us to spot-check your report before you send it to a client? Slide into our Twitter DMs @TryTripleWhale with a link to the report.
Conclusion
Awesome! You did it 👏🏼.
Now you understand how to leverage Triple Whale to:
- Identify Top Products
- Calculate Top Product LTV
- Derive Optimal Messaging/Ads Cadence
- Understand Golden Paths of Top Products
One last thing: this is a great analysis to perform for a prospective client.
First, it builds an insane amount of client capital through the perception of competency & expertise.
Second, you can see what the business looks like under the hood.
Understanding the REAL economics of the business versus what the owner tells you will alleviate a lot of friction and misalignment down the road.
Ready to take your analytics and attribution to the next level? Try Triple Whale today!


